Continuing on in the navigation series I’ve been writing about recently, today I wanted to look at Contour Lines.
We started with Map Reading Basics and then moved to Setting a Map so I thought moving into some of the main map features would be a logical place to move to next.
What are Contour Lines?
Contour lines are wavy circular lines employed on a two dimensional topographic map that depict elevation on the ground. The distance between each contour line is set to represent a certain level of elevation with zero being sea level. Most maps I use, the distance between the contour lines represents 10 meters.

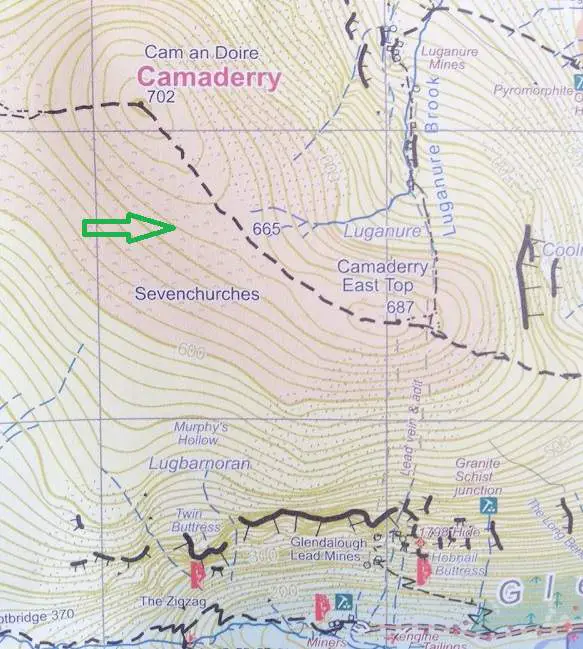
So, if we look at the picture above, you can see a contour line highlighted by the green arrow. You can also see the wavy circular type lines get smaller and smaller as they reach the top of the mountain where it says ‘Camaderry 702’.
Remember, a topographic map depicts a three dimensional space in a two dimensional format. So if you imagine the top of the mountain being squished downwards from the top into the ground, that’s what you have above. The contour lines depict the height of said mountain in the two dimensional space.
Using Contour Lines in the Mountains
So, now we have an idea of what contour lines on a map are. So what can you use them for when hiking? Well, in short, they help you plan your hiking route safely and to take alternative action on a route should you need to.
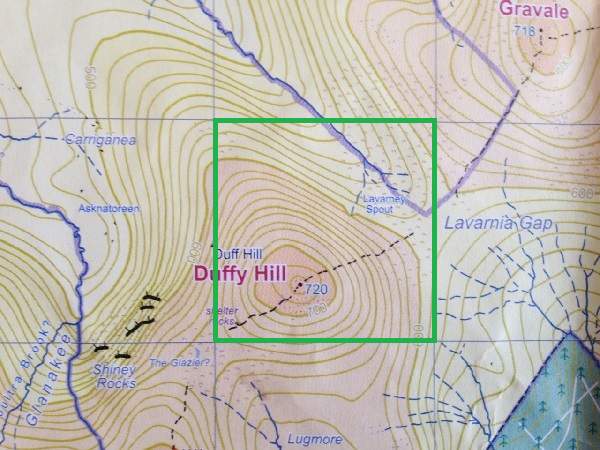
What do I mean by this? Well, say I’m sitting the night before planning my hiking route for the following day. I can use my map to measure distance and height to a particular point. Distance being the length of space across one square in the example below and height being the amount of contour lines in the same space.
In the example below, we can see there are 13 contour lines from the bottom right corner, lets call it point A, of the square highlighted in green to the ‘720’ peak of the mountain, let’s call it point B. As we know the distance between each contour line is 10 meters, we know that from point A to Point B there is an elevation of 130 meters, 13 * 10 meters.
As well as that, this map uses a 1:25k scale. So, one square, 4 cm’s in length on the map, depicts 1 kilometer (4*25,000cm’s) on the ground.
So, if I also measure the distance on the map across from point A to Point B, I get approximately 2.5 cm’s. So, if 4 cm’s represents 1 km, that means the distance on the ground is about 625 meters.
Next Step
So now I know from point A to point B there is an elevation of 130 meters and a flat distance of 625 meters. Therefore, I can now tell that to get from point A to Point B I need to travel 755 meters in total.

So now that I can measure distances and height, using route planning methods I can also start to make an estimation of how long it will take me to travel that distance. If I use 5 kilometers per hour as a walking speed, I know it will take me 12 minutes to walk across 1 box, 1 km, on the flat. Next up we need to account for the height element.
A generally accepted rule, although it is open to adaptation based on various factors like group size, speed, etc, is Naismith’s Rule. Part of this rule states that you allow one minute for every 10 meters of elevation.
Using the example above, with 13 contour lines, I allow 1 minute per contour line giving 13 minutes. I add that to about 6.5 minutes, for my 625 meters for walking the distance from point A to point B at 5 km per hour. That gives me 19.5 minutes in total. I can now estimate that it will take me 19.5 minutes to walk from point A to point B.
So, in practical terms I can apply this to my whole hiking route in advance and I can work out a good route for however long I want to be out hiking for.
Other Important Uses Of Contour Lines
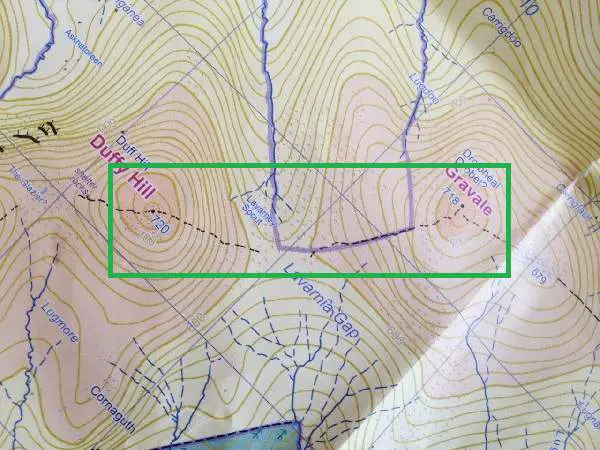
As already reviewed, contour lines depict the elevation of the ground on a map. Given that the distance between each contour line is 10 meters, what do the contour lines in the green box below depict?

Well, if I start at ‘720 Duffy Hill’ and follow the black dashed line to the right, I can see the circles going down in a nice and similar fashion. In the middle of the box, I can see there is a spot with no contour lines. Then if I keep going right and follow the next black dashed line up to Gravale, I can see a similar set of contour lines rising upwards to the dot at ‘718’ at the top.
So, on the ground I can expect a nice gradual slope downwards from Duffy Hill in to a flat bit in the middle and then the land starts to rise upwards again to the top of Gravale. What does that indicate? This is known as a Col or Saddle and is one of the main recurring features of mountains on maps but we’ll look at that in more detail in another post.
For the purposes of this post, from looking at how the contour lines on the map lie, I can tell that this is probably a very walkable part of the mountain. The wider the space between the contour lines indicates that 10 meters is rising over a wider distance. That show’s that it’s not too steep or dangerous, gently going down into a flat piece of ground and then gently rising up. so definitely a good way to consider for my hiking route.
Another Scenario
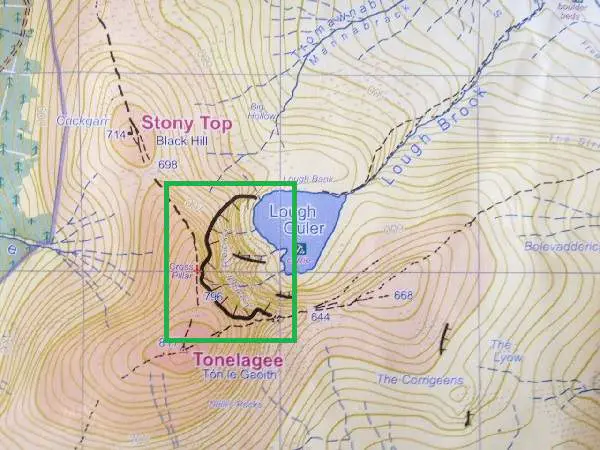
Keeping the above in mind, let’s look at another scenario. Looking at the picture below, what do you think the contour lines are telling you?

As you can see, this is opposite to the previous picture above. The contour lines are tightly bunched together. We know that the space between each contour line represents 10 meters. Therefore, in this scenario we can see that as the lines are so close together, this area must be very steep.
So, we can say that this is not a good place to walk to as part of your hiking route as it is quite possibly not passable and probably more hazardous.
Summary
So, there you have it. Today we took another sojourn into the wonderful world of map reading and navigation and hopefully you found this introduction to contour lines on topographic maps useful. As you can see, there is a lot to think about and hopefully you get an idea of how maps are so vital to ensure you have a safe and enjoyable hike.
They are vital for planning your route, especially if you plan to hike into open mountain. They’re also a must if you plan to hike into mountains you’ve never hiked in before.
As well as being a critical thing to help you plan your route, they also enable you to adjust your route as you hike should the need arise. Perhaps, the weather turns nasty and you need to change your plans and leave your planned route and get down as quickly as possible. This is again where your map and compass is critical, as without it, you won’t know where to go.
As I have mentioned before on the site, while resources like this post and videos etc. are great to get you started on working with maps for your hiking, it’s important you start your real life practice in very safe areas. That is, start by trying to follow maps on very well marked trails where you can easily find your way back to base should you need to.
If you’re in a hiking club or group, you can probably learn a lot from the more experienced folks in the group who will, from my experience, be only too happy to share their map reading, navigation, knowledge with you.
Conclusion
All the above should get you comfortable with the basics of map reading and navigation over time. However, I highly recommend that if you want to extend your hiking adventures into open mountain, unknown areas, lead groups, etc., that you take the time to take a navigation course with an experienced mountain guide.
Most States and Countries will have some kind of official body that offers an official course so I recommend looking for those if you can get them.
So, that’s it for today. Did you find this useful as an introduction to contour lines on maps? Have I missed anything important? I’d love to hear your thoughts in the comments below.